こんにちは。NewsPicksでソフトウェアエンジニアをしている森田です。 今回は業務の中で実際におこなった Node.js の CPU プロファイリングについてご紹介します。
なぜプロファイリングをおこなったのか
現在私が運用・開発しているWebサービスの Webフロントは React で動いています。
あるとき、ありがたいことに多くのアクセスがあった際に Reactを配信するために Node.js (Express) が動いている Webサーバー のCPU利用率が異様に高くなる現象が発生しました。 より多くのリクエストを捌くためにどの処理がCPUヘビーになっているか調査をする必要がありますが、そのなかで Node.js で CPU プロファイリングをすれば原因が特定できるのではないかということで下記で説明するCPUプロファイリングを行いました。
プロファイリング方法
今回ためしたプロファイリングは以下の2つです。
- v8 simple profiler
- chrome の inspect
また、プロファイリングの際にサーバーに負荷をかけるツールとしては、Apach Benchmark*1 を利用しました。
ここでは詳細な説明は省かせていただきますが、以下のようにリクエスト数と並列数などを指定して簡単に負荷をかけることができます。
# 記事ページに対して 50 並列で 1000 リクエスト負荷をかける
$  ab -n 1000 -c 50 http://localhost:3000/articles/5
それでは、それぞれのプロファイリング方法について説明していきます。
V8 simple profiler
こちらは名前の通り、V8 が提供している profiler を Node.js から呼び出す方法になります。
実行方法は簡単で、node の実行時に、--prof オプションをつけて実行します。
私の環境では以下のような npm script を用意しました。
  "start:build": // ...
  "start:prof": "NODE_ENV=production  node --prof .server.js",
そしてサーバーを起動し負荷をかけます。
$ npm run build:prof
$ npm run start:prof
$ ab -n 1000 -c 50 http://localhost:3000/articles/5
これらを実行するとプロジェクトルートに以下のようなログファイルが生成されます。(d は16進数文字列)
isolate-0xddddddddd-ddddd-v8.log
上記ファイルを開いていただくとわかりますが、このままだとよくわからないので以下のコマンドでまとめたものが見れます。
node --prof-process isolate-0xddddddddd-ddddd-v8.log > processed.txt
生成された、processed.txt を見ると以下のようなセクションに別れています。
Statistical profiling result from isolate-0x1042d2000-82938-v8.log, (58531 ticks, 440 unaccounted, 0 excluded).
[Shared libraries]:
  ticks  total  nonlib   name
   // ..

 [JavaScript]:
   ticks  total  nonlib   name
   // ..

 [C++]:
  ticks  total  nonlib   name
  // ..

 [Summary]:
   ticks  total  nonlib   name
   7356   12.6%   13.1%  JavaScript
  48276   82.5%   86.1%  C++
   2282    3.9%    4.1%  GC
   2459    4.2%          Shared libraries
    440    0.8%          Unaccounted

 [C++ entry points]:
   // ...

 [Bottom up (heavy) profile]:
  Note: percentage shows a share of a particular caller in the total
  amount of its parent calls.
  Callers occupying less than 1.0% are not shown.

  // ...
上から [Shared libraries], [JavaScript], [C++], [Summary], [C++ entry points], [Bottom up (heavy) profile] というセクションになります。
まず全体感をみるのに、[Summary] を見るのがよさそうです。重い処理を詳しく見たい場合は、[Bottom up (heavy) profile] を見るのが良さそうです。
順番に見ていきます。
[Summary] を見てみると上記の例だと、C++ が 86.1% とCPU負荷の大体を閉めていることがわかります。
[C++] のセクションでは、C++ 内の実行内容が表示されますが、ここは v8 内で行われている処理が多いのでここはチューニングできそうにありません。
次に [JavaScript] のセクションを見てみると以下のような内容になっていました。(一部プロジェクトパスなど書き換えています)
 [JavaScript]:
   ticks  total  nonlib   name
    630    1.1%    1.1%  LazyCompile: *murmur2 /path/to/workspace/project_name/node_modules/@emotion/hash/dist/hash.cjs.prod.js:3:17
    531    0.9%    0.9%  LazyCompile: *b.renderDOM /path/to/workspace/project_name/node_modules/react-dom/cjs/react-dom-server.node.production.min.js:48:95
    472    0.8%    0.8%  LazyCompile: *b.read /path/to/workspace/project_name/node_modules/react-dom/cjs/react-dom-server.node.production.min.js:42:241
    470    0.8%    0.8%  LazyCompile: *b.render /path/to/workspace/project_name/node_modules/react-dom/cjs/react-dom-server.node.production.min.js:44:262
    435    0.7%    0.8%  LazyCompile: *M /path/to/workspace/project_name/node_modules/react/cjs/react.production.min.js:14:11
    343    0.6%    0.6%  LazyCompile: *render /path/to/workspace/project_name/node_modules/@emotion/core/dist/core.cjs.prod.js:42:125
    289    0.5%    0.5%  LazyCompile: *T /path/to/workspace/project_name/node_modules/react/cjs/react.production.min.js:17:11
    210    0.4%    0.4%  LazyCompile: *Typography /path/to/workspace/project_name/libs/views/components/commons/atoms/Typography/index.js:36:20
    177    0.3%    0.3%  LazyCompile: *aa /path/to/workspace/project_name/node_modules/react/cjs/react.production.min.js:19:12
    157    0.3%    0.3%  RegExp: ["'&<>]
ほとんどが外部のライブラリで、react-dom-server などが多く出ています。
また、LazyCompile という表記がでていますが、こちらは遅延コンパイルされていることを意味しています。(先頭に * がついていれば最適化されているそうです)
最後に、 [Bottom up (heavy) profile] セクションを見ていきます。
 [Bottom up (heavy) profile]:
  Note: percentage shows a share of a particular caller in the total
  amount of its parent calls.
  Callers occupying less than 1.0% are not shown.

   ticks parent  name
  29320   50.1%  T __ZN2v88internal16DeclarationScope31CheckConflictingVarDeclarationsEv
  10057   34.3%    T __ZN2v88internal16DeclarationScope31CheckConflictingVarDeclarationsEv
   1262   12.5%      T __ZN2v88internal16DeclarationScope31CheckConflictingVarDeclarationsEv
    167   13.2%        LazyCompile: *b.renderDOM /path/to/workspace/project_name/node_modules/react-dom/cjs/react-dom-server.node.production.min.js:48:95
    167  100.0%          LazyCompile: *b.render /path/to/workspace/project_name/node_modules/react-dom/cjs/react-dom-server.node.production.min.js:44:262
    167  100.0%            LazyCompile: *b.read /path/to/workspace/project_name/node_modules/react-dom/cjs/react-dom-server.node.production.min.js:42:241
    109    8.6%        LazyCompile: *escape /path/to/workspace/project_name/node_modules/react/cjs/react.production.min.js:15:175
    109  100.0%          LazyCompile: *T /path/to/workspace/project_name/node_modules/react/cjs/react.production.min.js:17:11
     71   65.1%            LazyCompile: *X /path/to/workspace/project_name/node_modules/react/cjs/react.production.min.js:19:246
     38   34.9%            LazyCompile: *T /path/to/workspace/project_name/node_modules/react/cjs/react.production.min.js:17:11
     89    7.1%        LazyCompile: ~<anonymous> /path/to/workspace/project_name/libs/server/index.js:145:14
こちらを見ていくと、どうやら、react-dom-server の renderDOM すなわち、SSR (Server Side Rendering) 時のDOMの構築が CPU の負荷になっていそうなことがわかります。
Chrome の inspect
もう1つの方法としては、Chrome の inspect を使用する方法があります。
こちらを利用するためには、node の実行時に、--inspect のオプションを追加します。
  "start:build": // ...
  "start:prof": "NODE_ENV=production  node --inspect .server.js",
実行されたら、Chromeで、chrome://inspect を開きます。

上記のような画面になるので、一番したの inspect をクリックすると下記のようなWindowが開きます。

この状態で左上の 録画マークを押すと、Profiling が始まるので先ほどと同様に、ab コマンドなどで負荷をかけて計測を行います。
計測を行うと以下のように、ツリー上でCPU負荷の高い項目をみることができます。
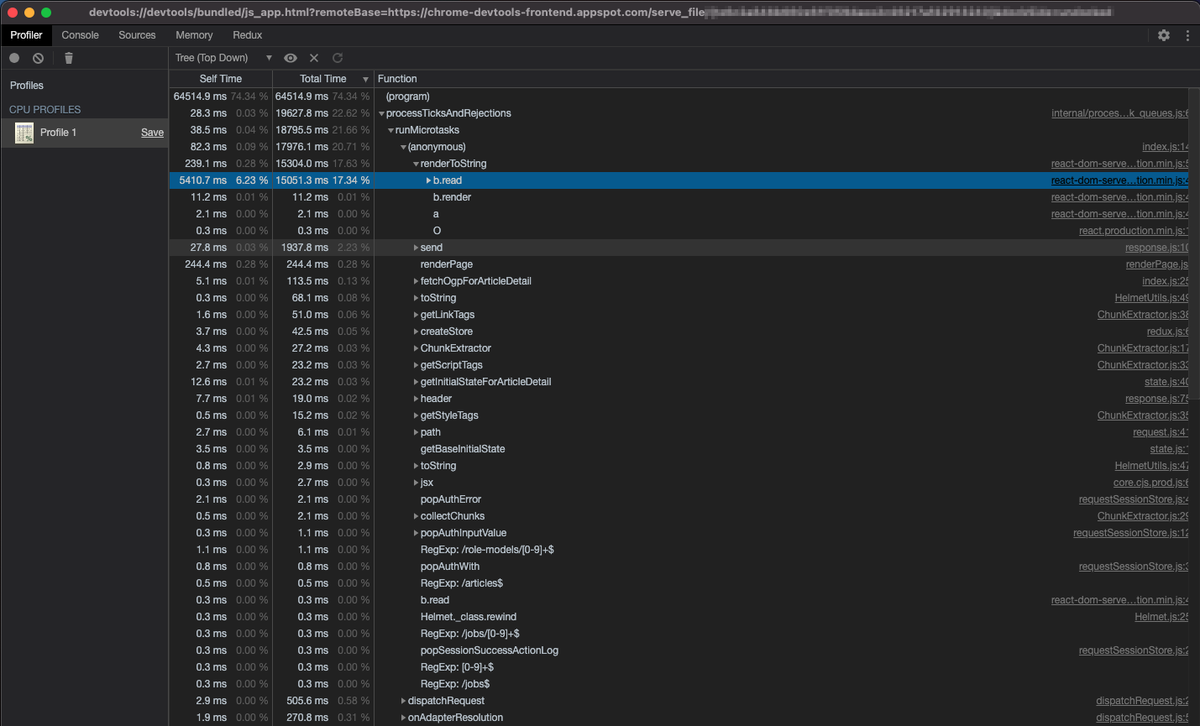
一番上記の (program) となっているところは、devtool 自身のCPU利用率とのことです。*2
二番目に大きい、runMicrotasks の下を見ていくと、react-dom-server の renderToString 、つまり SSR 時のDOM構築がやはり重いことがわかりました。
おわりに
今回は、Node.js で2種類の CPU プロファイリングを行う方法を紹介させていただきました。 結果としてSSR時のDOM構築にCPU負荷がかかっていそうなことがわかりました。
プロファイリングをする前から CPU ヘビーな処理といったら HTML文字列組み立てたりするところかなぁ、となんとなくあたりはついていたのですが「推測するな計測せよ」ということもあり実際にプロファイリングを行いました。(計測するのはとても大事だと思ってます。)
今後は根本解決として、Cacheを上手く使ったり、Partial Rendering (例えば、First View のみ SSR する など) あたりを候補に入れて調査と修正を行なっていきたいと思います。 この記事がどなたかのお役にたてれば幸いです。